.png)
September 11, 2025
8 minute read
An ABM dashboard is your central hub for tracking how high-value accounts engage, move through the pipeline, respond to campaigns, and ultimately drive revenue.
Unlike lead-based dashboards that focus on individual contacts, an ABM dashboard zooms out to the account level.
It shows firmographics, technographics, deal stages, and buying signals across the entire buying committee, serving as the operational backbone of any ABM campaign in HubSpot.
Here’s what it helps you do:
Bring together firmographics, technographics, CRM activity, and intent signals into a single account view. That means no more piecing together spreadsheets or toggling between tools.
Highlight accounts engaging with your brand (website visits, ad clicks, webinar signups) and add external buying intent signals from tools like Clay (e.g. funding rounds or hiring surges) to focus sales efforts on companies that are most likely to convert.
Follow entire accounts as they move through the ABM funnel—from awareness to closed-won. Spot where accounts get stuck or stall.
Link multi-channel campaigns to revenue. See which ones influence pipeline, create opportunities, and bring money.
Use the dashboard as a single source of truth. Marketing and sales work from the same account data, reducing friction and helping everyone stay focused on shared KPIs.
A complete ABM Dashboard includes:
Account Firmographics and Technographics
ABM Funnel Reporting
Campaign Performance
Together, they give marketing and sales teams the operational visibility to target the right accounts, track their progression, and prove campaign impact.
Below, you’ll see a full breakdown of such a dashboard, with HubSpot reports and examples straight from our CRM.
This section shows you how to profile and prioritize target accounts using firmographic and technographic data.
Firmographic data: company data like size, industry, revenue, location, and growth stage. They help you spot organizations that fit your ideal customer profile.
Technographic data: account's technology stack and digital maturity. This shows you exactly how your solution fits into their existing setup.

(HubSpot ABM Dashboard: Target Accounts By Country)
This view breaks down target accounts by employee count, helping you understand the company size distribution within your ABM list.

(HubSpot ABM Dashboard: Target Accounts By Size)
This report groups accounts based on headcount trends—whether they're scaling quickly, growing steadily, or remaining flat. It helps surface expansion-stage companies that may be ramping up hiring, increasing budget, or bringing in new decision-makers.

(HubSpot ABM Dashboard: Target Accounts by Growth)
This chart segments your target accounts by annual revenue bands defined in your ICP. It helps estimate deal size potential and reveals whether your current focus leans more toward SMBs, mid-market players, or enterprise buyers—a critical lens for shaping your ABM strategy.

(HubSpot ABM Dashboard: Target Accounts by Revenue)
This report highlights the monthly web traffic of your target accounts—a strong signal of their digital maturity, brand visibility, and likely marketing investment.

(HubSpot ABM Dashboard: Target Accounts by Website Traffic)
This report maps the geographic distribution of your accounts by city. It's especially useful for planning regionally targeted outreach, hosting field events, or aligning sales coverage in markets where proximity matters.

(HubSpot ABM Dashboard: Target Accounts by City)
This report reveals the most frequently used tools and platforms across your target account list. It helps you understand the tech environment you're selling into, tailor your value prop around integrations, and position your offering as a seamless fit within their existing stack.

(HubSpot ABM Dashboard: Key Technologies Among Target Accounts)
This part of your ABM dashboard in HubSpot tracks how target accounts move through key stages of the account lifecycle—from Identified to Closed Won.
Unlike lead-based funnels, this model reflects progress at the company level, using contact behavior to trigger account status changes via lists and workflows.
Each stage is advanced by a specific trigger.
For instance, an account moves from Identified to Aware after an ad engagement or website visit, and from Engaged to Considering once a meeting is booked.
Let's take a closer look at all the stages in chronological order.

(HubSpot ABM Dashboard: All Target Accounts)
These are accounts that have shown early signals—ad views, website visits, or email opens.
This view helps you track which accounts have become aware of your brand.

(HubSpot ABM Dashboard: Aware Accounts)
Accounts move here once at least one contact has meaningfully interacted with your content, such as downloading an asset, attending a webinar, or visiting key pages.
It helps you prioritize accounts showing genuine interest and signals readiness for sales outreach.

(HubSpot ABM Dashboard: Engaged Accounts)
This stage is triggered when someone from a target account requests or books a meeting.
It signals active evaluation—the account is clearly exploring your solution.
Tracking this stage helps align marketing and sales on next steps, like follow-up strategy or bringing in subject matter experts to move the deal forward.
.

(HubSpot ABM Dashboard: Considering Accounts)
A deal has been created, a clear signal that the account is qualified and actively in a buying motion.
This view gives your team visibility into sales funnel health and helps evaluate whether ABM programs are generating opportunities, not just engagement.

(HubSpot ABM Dashboard: Account with deal opened)
At least one deal has been closed. This stage confirms that the account has converted into a customer.
It validates your targeting, messaging, and sales execution—and it's essential for analyzing ABM ROI.

(HubSpot ABM Dashboard: Won Accounts)
This part of the ABM dashboard in HubSpot connects your campaigns directly to business outcomes.
It focuses on the financial indicators—how campaigns influence pipeline, revenue, and deal quality at the account level.
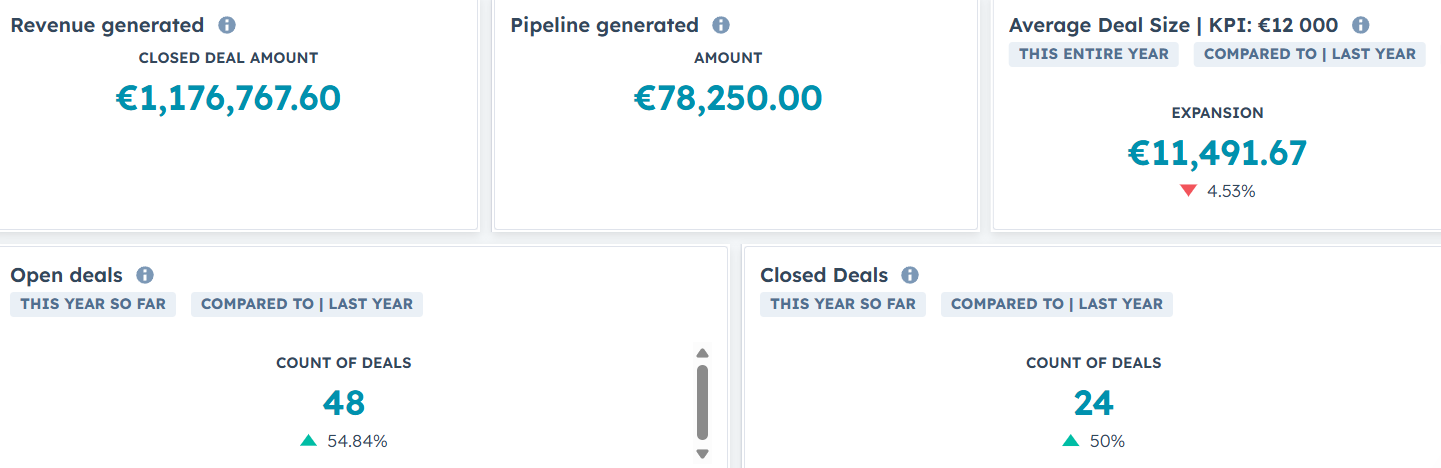
This is your executive snapshot. It answers the core ABM performance question: Are campaigns driving a high-quality pipeline that converts to revenue?
Here, you track:
Revenue Generated
Pipeline Generated
Average Deal Size
Open Deals
Closed Deals
(HubSpot ABM Dashboard: Financial Metrics)
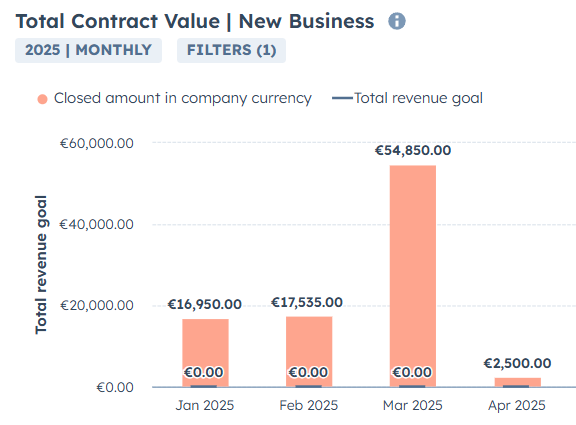
This report shows the monthly value of closed-won deals and how that compares to your revenue targets. This is how you translate ABM into business wins—and where there's still a gap between pipeline potential and closed revenue.
(HubSpot ABM Dashboard: Total Contract Value)
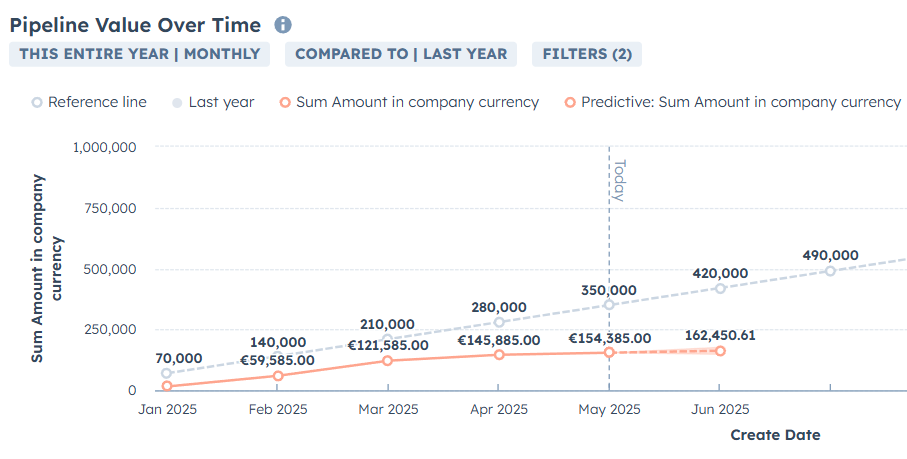
Tracks pipeline creation every month and compares performance year over year. It helps you spot trends, identify campaign seasonality, and ensure you're pacing toward revenue goals.
(HubSpot ABM Dashboard: Pipeline Value Over Time)
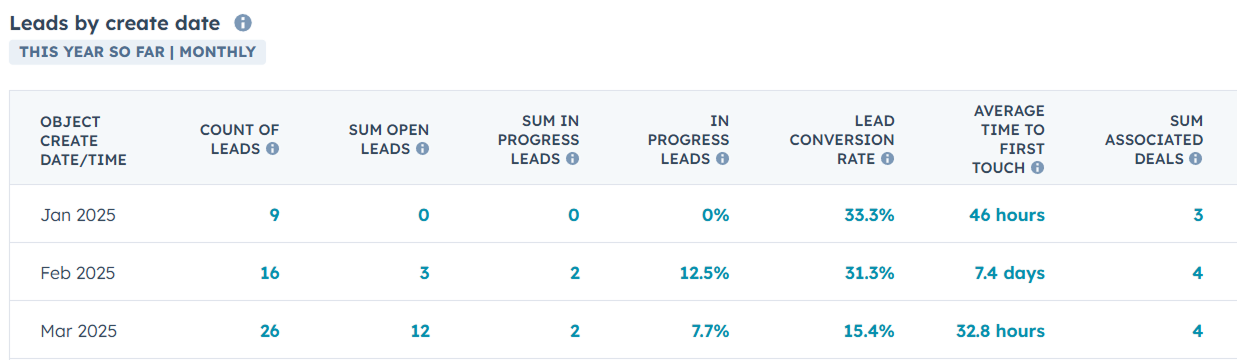
Look at how many leads are being generated by ABM campaigns, how fast they’re being worked, and how they convert.
It shows lead volume, lead status, and time-to-first-touch so you can evaluate how responsive your team is and whether the pipeline is flowing efficiently.
(HubSpot ABM Dashboard: Leads by Create Date)
Let’s summarize how you should structure the ABM Dashboard in HubSpot. We’ve broken it down into key components—each tied to specific data sources and filters.
From firmographic insights to funnel movement and campaign performance, here’s how it all connects to give you a clear view of your ABM efforts.

(HubSpot ABM Dashboard: Structure Summary)
So far, we’ve covered how to structure your ABM dashboard in HubSpot around account insights, funnel stages, and campaign impact.
But to make all of this work, you need operational logic that updates account status in real time based on associated contact activity.
Let’s walk through how to build that in four simple steps:
Start by outlining the key stages that an account moves through on its path to becoming a customer.
Below is a practical model you can adopt and tailor based on how your teams define the journey.

(ABM Funnel Stages for Target Accounts)
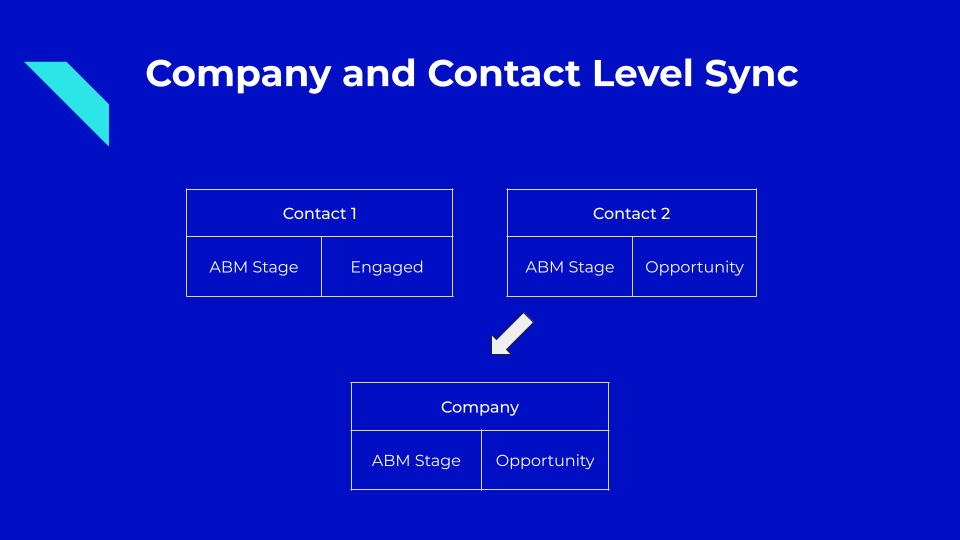
Here’s the core principle: an account inherits its ABM stage based on the most advanced activity of its associated contacts.
(Company and contact level sync in HubSpot ABM)
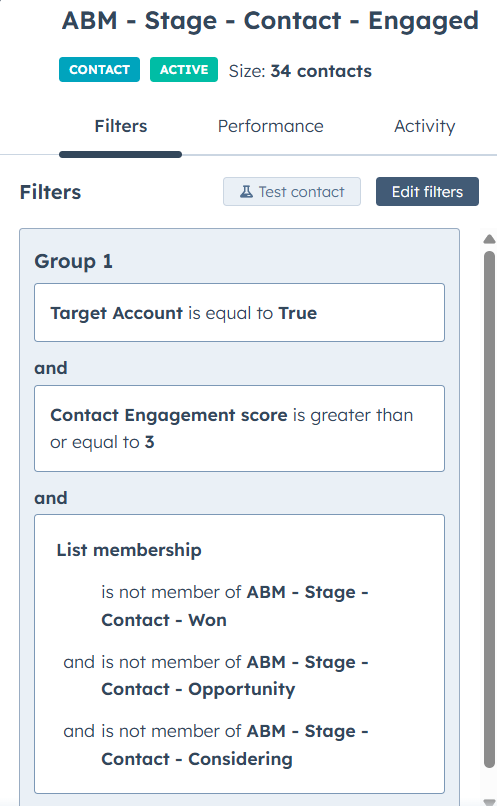
For example, when a contact enters the "Engaged Contact" list (based on actions like content interaction or repeated site visits), the associated company becomes eligible for the "Engaged Account" list.
This list is then used to update the company's ABM stage.
If a contact is linked to an open deal, that account progresses to the Opportunity stage automatically.
(HubSpot List: Contact ABM Stage - Engaged)
Now that your contact-based logic is in place, the next step is to translate it into company-level lists.
HubSpot doesn’t automatically update account stages based on contact behavior.
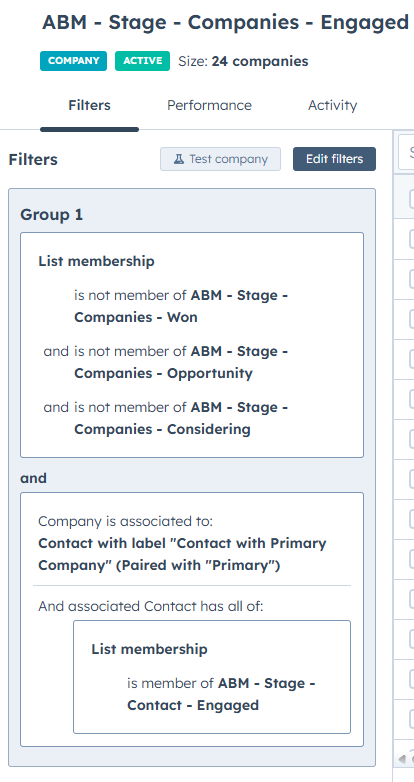
That’s why you need company lists with association-based logic. For each ABM stage, build a company list that checks:
Is the company not already in a more advanced stage? (e.g., if you're evaluating for "Engaged," exclude accounts already marked as Considering, Opportunity, or Won)
Is the company associated with a contact in the matching contact list? For example, if a contact is in the “ABM – Stage – Contact – Engaged” list and has a primary association to the company, then the company qualifies for the “Engaged Account” list.
(HubSpot List: Company ABM Stage - Engaged)
This mirrors the funnel logic while maintaining clean progression between stages.
With your contact and company lists built, use a HubSpot workflow to update account stages automatically.
Here’s how:
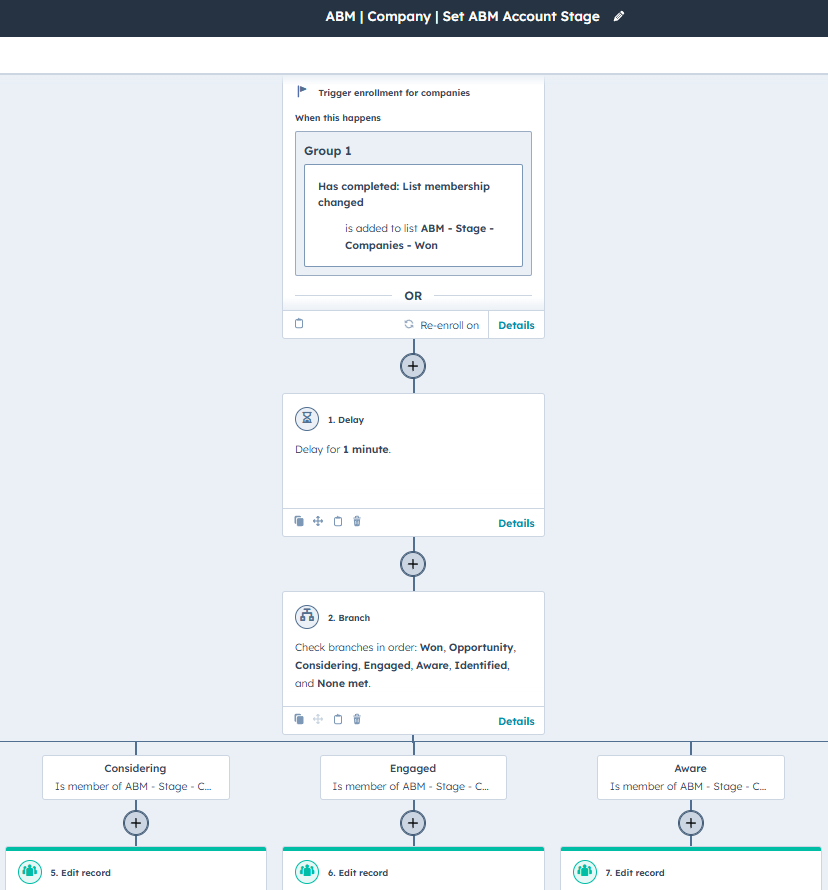
Trigger the workflow when a company joins any of the stage-based lists (e.g., “ABM – Stage – Companies – Engaged”).
After a short delay (e.g., 1 minute), check list membership across all stages—from most advanced to least: Won → Opportunity → Considering → Engaged → Aware → Identified.
Use the “Set property value” action to assign the ABM Stage (e.g., set to "Engaged").
(HubSpot ABM Workflow: Setting ABM Account Stage)
This logic ensures:
Only one ABM stage is active at a time.
Stage always reflects the most advanced contact engagement.
Manual updates and skipped stages are fully avoided.
ABM reporting is hard by design. It requires aligning multiple data sources, tracking touchpoints across long sales cycles, and attributing pipeline to coordinated campaigns.
When your systems aren’t set up for that complexity, things break down quickly.
Here are three common ABM reporting challenges and how your team can address them through smarter systems and tighter execution.
ABM programs run across a lot of touchpoints: paid ads, webinars, email nurtures, live events, outbound calls.
Each one plays a role in moving accounts forward, but tracking all of them at the account level is tricky.
The problem:
When your data lives in separate tools (CRM, ad platforms, web analytics), it creates blind spots:
Some interactions get double-counted
Others go completely unnoticed
Engagement scores become fragmented or misleading
How to solve it:
Build a centralized integration strategy so platforms like HubSpot, Clay, LinkedIn Ads, and your analytics tools sync into one view.
Use lead-to-account matching to merge interactions across contacts and companies into a single account timeline.
ABM campaigns often trigger activity months before any revenue appears in your CRM. That lag makes it difficult to connect engagement to actual business impact, especially when leadership wants quick answers to, “Is this working?”
The problem:
You engage a key persona in Q1, run three campaigns to nurture them in Q2, and only see a closed-won deal in Q4. Without visibility into that journey, your reporting looks disconnected.
How to solve it:
Use HubSpot’s account-level funnel reporting to link early engagement stages like Aware, Engaged, and Considering to opportunity creation and revenue.
This lets you show momentum before deals close, helping justify investment in long-cycle ABM plays.
Without clean, complete, and enriched account data, reports will mislead your sales and marketing team.
The problem:
You see inconsistent firmographics, missing technographics, or duplicate accounts split across regions and domains.
These gaps skew segmentation, inflate funnel stages, and break attribution.
Accounts appear unengaged simply because key contacts aren’t associated or enrichment is incomplete.
How to solve it:
Use Clay to standardize and enrich account data by pulling fresh firmographic and technographic data into HubSpot.
If you're struggling with account-level reporting, our team can help.

We specialize in building ABM dashboards in HubSpot with clear account insights, ABM funnel and campaign attribution—so you finally see which accounts are progressing and what's driving revenue.
Most ABM teams struggle to connect account engagement signals to pipeline and revenue, especially when insights are scattered across tools.
Without a structured reporting system, decisions are made on gut feeling, engagement is misread, and campaign impact goes unproven.
An ABM dashboard in HubSpot changes this by turning contact-level activity into account-level visibility.
It aligns strategy with execution, giving sales, marketing, and RevOps a shared system to monitor account engagement, funnel movement, and campaign-driven revenue.
When done right, HubSpot becomes the single source of truth for ABM performance, improving accountability, and resource allocation.
Key Takeaways for building your ABM Dashboard in HubSpot:
3-Part Structure: Every ABM dashboard should include:
Target Account Insights – firmographics, technographics, growth, traffic
Funnel Reporting – account stages (Identified → Won) based on contact behavior
Campaign Results – influenced pipeline, deal value, and revenue impact
Core Workflow Logic:
Score contact engagement (web visits, content, meetings)
Trigger company list membership based on contact activity
Use workflows to set company ABM stages automatically
Tools to Extend HubSpot:
Avoid Reporting Gaps:
Result: A single, reliable source of truth for tracking ABM program effectiveness—built directly into HubSpot.